

 Read this first


Fuel Economy Monitor
Fuel Economy Monitor (Some Models)
Effectiveness Display
The actual performance of the energy efficiency is displayed.
|
Indication on display |
Control status |
|---|---|
 |
|
|
|
|
|
|
|
|
|
|
|
|
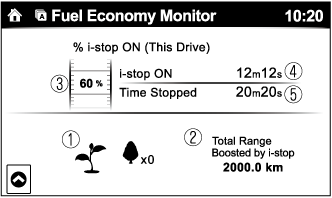
 The leaf graphic grows according to the amount of CO2 emissions reduced by the system effects. The cumulative total amount of leaf growth is indicated in terms of the number of tree graphics.
 Displays the total driving distance which could be extended by the operation of the i-stop function.
 Displays the percentage of time that the vehicle was stopped by the i-stop function operation out of the total amount of time that the vehicle was stopped.
 Displays the amount of time that the i-stop function has operated.
 Displays the total amount of time that the vehicle was stopped.


